本書 "5.2.4. Evaluating ranking models" をもとにした。
Two other standard measures of a ranking model are Spearman’s rank correlation coefficient (treating assigned rank as a numeric score) and the data mining concept of lift (treating ranking as sorting).
ranking モデルの評価には、二つの標準的な方法がある。
そのうちの一つ lift については「Lift Curve(リフト曲線)」を参照。
Ranking evaluation is well handled by business-driven ad hoc methods, so we won’t spend any more time on this issue.
ranking 評価は、ビジネスに依存したアドホックな方法がとられることが多く、一般化は難しい。
クラスターモデル評価
クラスターモデルで、ranking 評価について考える。ところが
Clustering models are hard to evaluate because they’re unsupervised: the clusters that items are assigned to are generated by the modeling procedure, not supplied in a series of annotated examples.
クラスタリングモデルの評価が難しいのは、「教師なし学習」モデルだから。
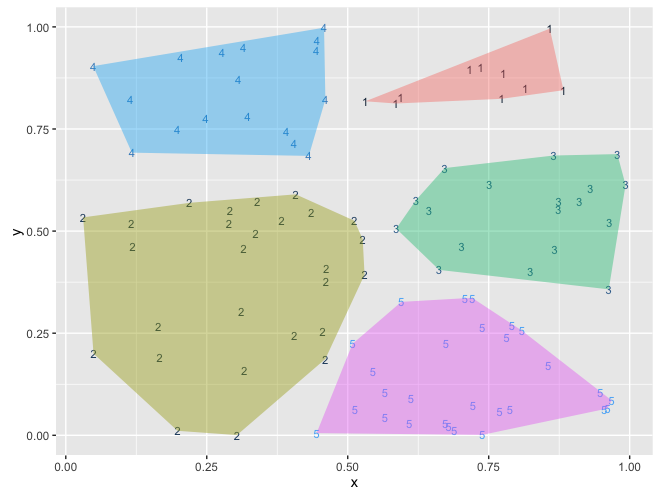
その難しさは直感的にも分かるが、具体例で示す。適当な二次元の乱数を作り、k = 5 でクラスタリングする。
> set.seed(32297)
> d <- data.frame(x=runif(100),y=runif(100))
> clus <- kmeans(d,centers=5)
> d$cluster <- clus$cluster
その結果を描画したの次の図 5.10 。
> library(ggplot2)
> h <- do.call(rbind, lapply(unique(clus$cluster),
function(c){f <- subset(d,cluster==c);f[chull(f),]}))
> ggplot() + geom_text(data=d,aes(label=cluster,x=x,y=y,color=cluster),size=3) +
geom_polygon(data=h,aes(x=x,y=y,group=cluster,fill=as.factor(cluster)),
alpha=0.4, linetype=0) +
theme(legend.position = "none")
各クラスター中の要素の数は
> table(d$cluster)
1 2 3 4 5
10 27 18 17 28
> table(d$cluster)
1 2 3 4 5
10 27 18 17 28
intra-cluster distances versus cross-cluster distances とは
The traditional measure of this is comparing the typical distance between two items in the same cluster to the typical distance between two items from different clusters.
「クラスター内での距離」と「クラスター間の距離」の比較。
> n <- dim(d)[[1]]
> pairs <- data.frame(
ca = as.vector(outer(1:n,1:n,function(a,b) d[a,'cluster'])),
cb = as.vector(outer(1:n,1:n,function(a,b) d[b,'cluster'])),
dist = as.vector(outer(1:n,1:n,function(a,b) sqrt((d[a,'x']-d[b,'x'])^2 + (d[a,'y']-d[b,'y'])^2))))
> dcast(pairs, ca~cb, value.va='dist', mean)
Using dist as value column: use value.var to override.
ca 1 2 3 4 5
1 1 0.1478480 0.6524103 0.3780785 0.4404508 0.7544134
2 2 0.6524103 0.2794181 0.5551967 0.4990632 0.5165320
3 3 0.3780785 0.5551967 0.2031272 0.6122986 0.4656730
4 4 0.4404508 0.4990632 0.6122986 0.2048268 0.8365336
5 5 0.7544134 0.5165320 0.4656730 0.8365336 0.2221314
このテーブルの各値は the mean distance from points in one cluster to points in another で、強調した対角線の値が intra-cluster distances「クラスター内の距離」。これらの値が小さいのは、「クラスター間の距離」より短いことを示す。
Distance metrics are good for checking the performance of clustering algorithms, but they don’t always translate to business needs. When sharing a clustering with your project sponsor or client, we advise treating the cluster assignment as if it were a classification.
この距離はクラスタリングの性能測定には良いが、ビジネスニーズに読み換えられるとは限らない。プロジェクトスポンサーや顧客とクラスタリングの結果を共有する場合、クラスターを分類器として扱うのがお勧めする。
例えば、メールのスパム検知で spam/non-spam の分類器のように、クラスターを使うということ。
0 件のコメント:
コメントを投稿